Your taste panel has been evaluating products for months when someone asks, “Are we seeing more flavor issues from one production line than another?” You have plenty of tasting results, but can you connect the dots?
It all depends on the context you saved along the way.
Sensory results become more useful when they remain connected to the circumstances behind each sample. Recording a few relevant details during collection gives your team a way to investigate patterns across months of evaluations.
What Are Tags and Data Segmentation?
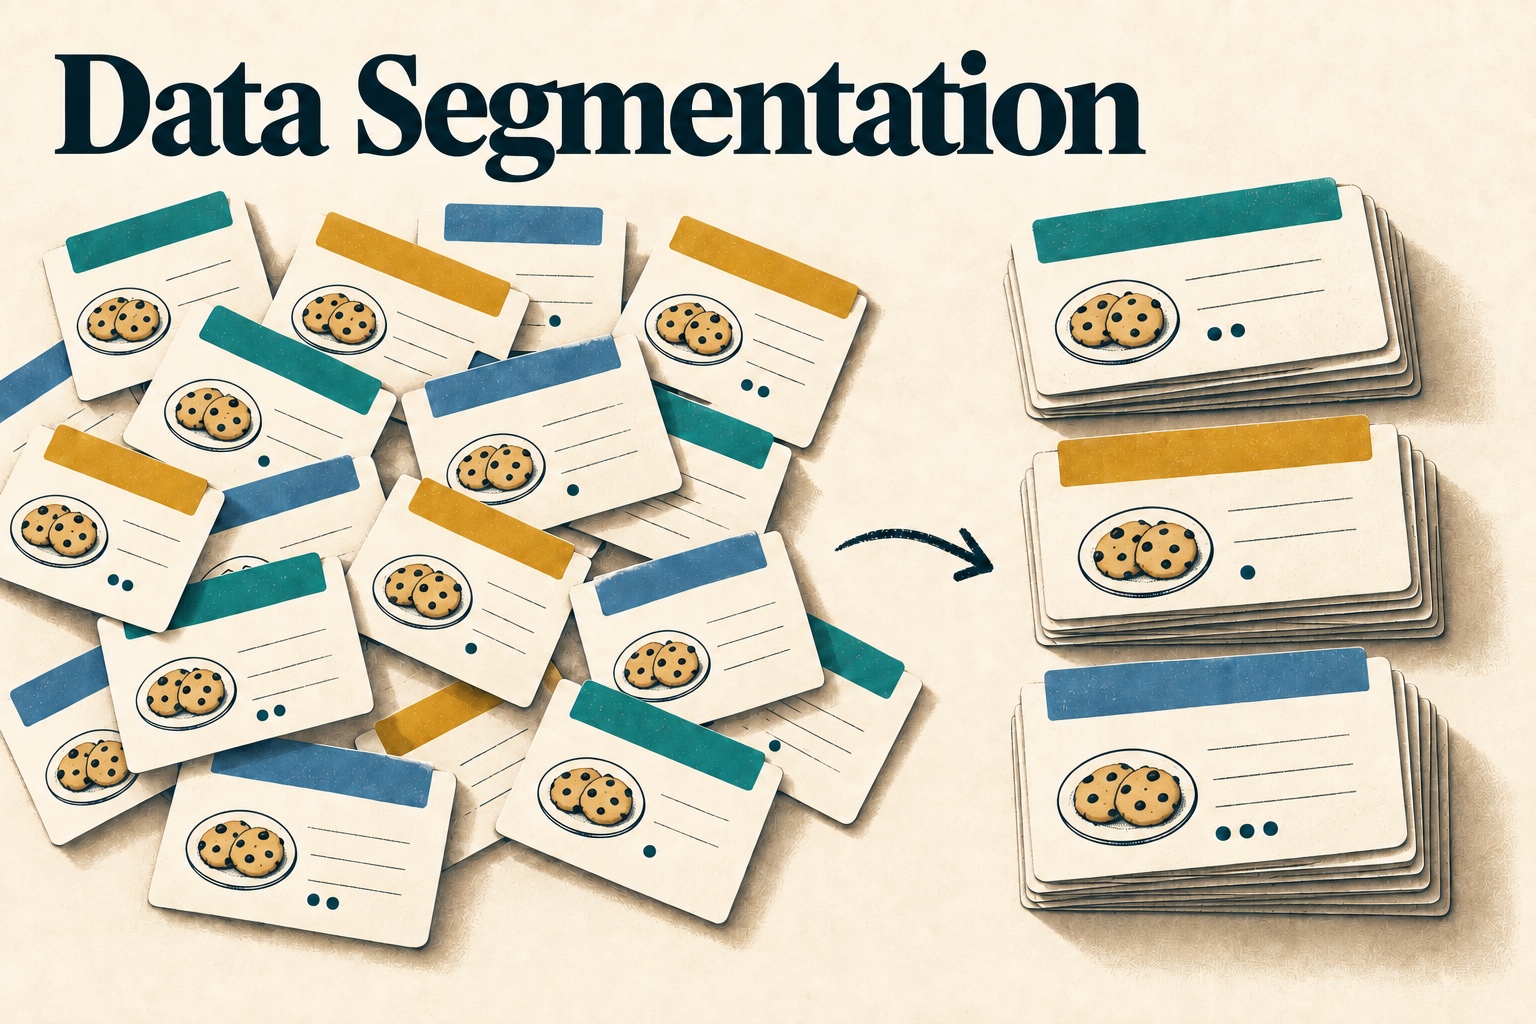
Data segmentation means separating results into meaningful groups. This allows you to do things like compare sample performance based on packaging format, storage conditions, ingredient source, facility, production line, or whatever else you may need.
In DraughtLab Pro, we use tags to let users segment results in reports. Each sample has a field where you can add tags, and report filters let you select the groups you want to examine.
Choose Tags That Answer Useful Questions
Start with questions your team regularly faces. Each one should point to information worth preserving and a comparison that could influence your next step.
Are ingredients contributing to flavor variation? Tag samples by supplier and ingredient lot to look for concerns that recur across batches sharing the same source.
Where in production might an issue originate? Tags for machinery, production lines, facilities, and packaging formats let you compare results across different parts of your operation and narrow an investigation.
Is your panel catching expected problems? We often put samples that we know should fail on panel (called spikes) to see if our panel can identify them. Tagging these samples lets you run a spiked sample report to review panel performance and identify training needs.
Can I dive deeper into prototype testing? R&D testing can really benefit from looking at the data from multiple angles. Tagging samples by prototype version, testing group, testing venue, or any other differentiator can help you better understand the results.
The questions will vary from one program to another, but the approach is the same. Decide what you need to compare, then make sure that information stays connected to your samples. That preparation can make a real difference when an unexpected issue comes up.
From a Tasting Result to a Correction
One project illustrates how this works in practice. A company invited us to trial our quality control methodology for a week to see what we could learn about their products. We established true-to-target evaluations, adjusted target descriptions, and developed a tagging plan that connected the samples to their production information.
During that week, the evaluations uncovered a quality issue that had gone undetected for more than a month. Using the tags to examine the affected results, we narrowed the issue to a single machine at one of their production facilities. The company corrected the machine, and the quality issues were resolved.
Collect What You Will Use
We have seen teams try to tag everything, burn themselves out maintaining the details, and never use the data. Every additional category creates work, so stick to the questions your program is designed to answer.
Use tags to connect multiple records. A batch number can group evaluations belonging to the same batch, while a single-use identifier belongs in one of DraughtLab’s other fields. Agree on consistent tag names and who assigns them so related results stay together in reports.
If you are unsure what you will need, start with a simple tagging structure and put it to work. As you review results, notice which questions remain unanswered because information is missing. Those gaps give you a practical reason to expand.